
-
Events
See all events here


-
Membership

Open to all those studying or working in transport planning, or related fields, on a professional basis.
Read Jonathan Flower's Blog
Author: Jonathan Flower, TPS Board Member and Researcher at the Centre for Transport and Society, UWE, Bristol 
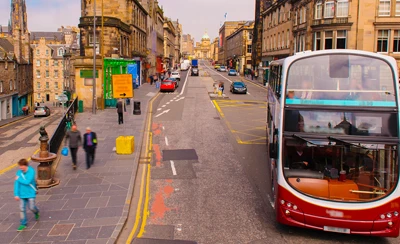
Improving inclusion on our car dominated streets
I am a product of the 1960s, born in a year that over 1,000 miles of railway lines were closed in the wake of the Beeching Report[i]. It was a decade when UK cities transitioned from being public transport dominated to private motor vehicle dominated. According to family folklore my first word reflected the times and instead of uttering “mama” or “dadda” I said “Volkswagen” and soon prided myself in being able to name all of the models on the road. The year before my birth Buchanan’s ‘Traffic in Towns’[ii] had been published which was written on the premise that everyone would want to own their own car, but with the realisation that if everyone had one, most urban centres would not be able to accommodate the demand for this door-to-door convenience. In parliament it was stated that “cars are a boon, but they have now started to choke movement and, indeed, to threaten the quality of urban life”[iii]. In response Buchanan introduced the concepts of designing for ‘place’ as well as ‘movement’, now well established in urban design guidance including ‘Manual for Streets’[iv]. The report acknowledged that although some town centres could be altered if enough money was available, it would still be necessary to improve public transport and to restrict the numbers of cars. With hindsight we can see that ‘Traffic in Towns’ announced the age of car dominance in urban streets, without ushering in the transport planning solutions that would avoid the numerous disbenefits of driving for everyone (especially pedestrians), including safety, anxiety, noise, pollution, vibration, and visual intrusion (Buchanan’s own list).

Journey to work modal choices as a percentage, in the UK
[Note. 1890-1999, data was sourced from 12,439 journeys to work in 1,834 life histories; statistics are calculated for the decade in which a particular journey to work started (Pooley and Turnbull, 2000); 2002-15 uses Department of Transport data (2017)]
So as streets have transitioned from public transport to private cars, and before that from walking and cycling, have they become more or less inclusive? Is anyone missing from our streets and if so, who and why? Who are the transport planners that can help create a street environment that is open to the full diversity of people and ages in our society?
Whose reality counts?
In the Buchanan report accessibility was equated with the ability to drive door to door and was assumed to be shortly within the grasp of most people, but 20 years later only one third of adults had a car and 50% a driving licence[i]. Almost no attention was given to the accessibility of people without cars. Today, people in households without access to a car make 55% of their trips on foot[ii]. These assumptions created great inequities and the solution of ‘movement’ corridors did not consider the effect of that environment for people living there or the severance that they would cause. Buchanan’s concept of ‘environment’ was “a method of arranging buildings for motor traffic” and overlooked the social aspects that would bring an end to children’s right to roam alone (at the time more than 95% of primary school children travelled alone and now fewer than 5% do[iii]), the consequences of road traffic collisions - the highest peace time road death rate of 7, 985 occurred in 1966[iv], the destruction of long-standing communities and the upheaval of years of construction. Additionally, the financial costs of achieving high private car accessibility were not properly evaluated and no low-cost mobility alternatives were considered. The resulting changes in urban forms included multi-storey car parks and pedestrianised shopping centres usually only accessible by car. The report created car-based living patterns and associated planning decisions that resulted in more dispersal, and car mileage per person rose 50% in 20 years. It seems clear that over the last half a century the reality of people in cars, especially if they are driving to work, has counted far more than the reality of children, parents with pushchairs, or users of mobility scooters, cycles or public transport, as they have tried to share the same streets.
Is there really a choice?
‘Choice, choice, choice’ has become a modern mantra, but what are the safe, comfortable, convenient, direct, inclusive options for travel from A to B in our urban centres? Beyond the car, what other door to door options do people have for the journeys that they wish to take? What choices exist for wheelchair or mobility scooter users when dropped kerbs and at level crossings are missing; or for 12-year-olds to cycle alone when the only option is to share the carriageway with four lanes of fast-moving traffic; or to push a double buggy when the footways are narrow; or to walk when visually impaired if routes are cluttered or blocked? Even when streets have been well designed with adequately wide footways and kerb separated cycle tracks, it seems that cities often plan for the perfect day, rather than the everyday. Planning and designs need to take account of bin day, temporary works, and scaffolding, because these are the daily reality and not an occasional inconvenience. As planners we talk about a user hierarchy of design with pedestrians at the top and the motor vehicles that can cause the greatest harm at the bottom, but too often we only pay lip service to this, and the reality is that most streets are still car dominated with the driver at the top and pedestrians and cyclists at the bottom. If choice, inclusion, and diversity have value, then this must change.
Removing intimidation from street environments
I have just completed research that demonstrated that those that feel marginalised from walking, cycling, or rolling[v] in their local streets, frequently feel intimidated by the street environment. These feelings come in response to poor design and the behaviour of other street users. The two are intertwined as good design can moderate poor behaviour, providing protection and separation from faster vehicles and also attract other users who can, as Jane Jacobs[vi] put it, have their “eyes on the street”. The National Travel Attitudes Survey (NTAS) wave 5vi suggests that unless we address intimidation, we cannot expect inclusion – only 43% of women feel confident when cycling compared to almost 75% of men and when asked what would encourage them to cycle more the top reasons are related to safety and infrastructure including:
- Off-road and segregated cycle paths (55%)
- Safer roads (53%)
- Well-maintained road surfaces for cycling (49%)
So how can we turn the tide and create more diverse and inclusive streets? The last 18 months of Covid-19 disruptions may provide a clue. At least for a time many people experienced their local streets as they had never experienced them before, no longer dominated by cars. Some people who would have otherwise not felt confident walking or cycling gave it a try and reported enjoying the experience. Department for Transport statisticsvi show that the number of cycling trips made by women in England rose by more than 50% in 2020 and the average number of cycle stages (where cycling was used for part of a journey, combined with another mode) increased by 56% compared with 2019. Men still cycle twice as much as women, but the gender gap has closed over the last year, as in previous years it was almost three times as much. This shows the potential for many more people to cycle, particularly the groups that participate less, if our streets were made safer, with more kerb separated routes. A recently published study[vii] suggests that there is an almost magic threshold of 7%. Cities and countries that achieve at least 7% mode share for cycling find that the majority of cyclists are women and that there is also good representation of children and improved cycling levels for older people; with lower cycling rates the working age population and men tend to be overrepresented. This seems like a good threshold for city planners to aim for if we want more inclusive streets.
Note: These views are my own and do not necessarily reflect the position of CTS or the University of the West of England.
--
[i] British Railways Board (1963) The reshaping of the railways. Part 1. Report. London: HMSO.
[ii] Buchanan, C. (1963) Traffic in Towns. A study of the long term problems of traffic in urban areas. Reports of the steering group and working group appointed by the Minister of Transport. London: HMSO.
[iii] Hansard vol. 253, col. 678. (27 November 1963) Available from: https://api.parliament.uk/historic-hansard/lords/1963/nov/27/the-buchanan-report-traffic-in-towns.
[iv] Young, A. and Jones, P., eds. (2010) Manual for Streets 2. London, UK: Chartered Institution of Highways and Transportation.
[v] Hillman, M., 1983. The Wrong Turning: Twenty Years on from Buchanan. Built environment, 9(2), pp. 104-112.
[vii] See Lucy Marstrand-Taussig’s blog: https://tps.org.uk/transport-planning-day-and-campaign/read-our-blogs/making-inclusion-more-inclusive-how-the-equalities.
[viii] Department for Transport, (2008) Reported Road Casualties Great Britain: 2008. Annual Report, UK: Department of Transport. Available from: http://d3n8a8pro7vhmx.cloudfront.net/20splentyforus/legacy_url/323/Road_20casualties2008.pdf?1431368043.
[ix] An inclusive phrase to cover the different ways that people might actively use streets on foot, cycling or using other wheeled devises. By extension it also includes e-assist modes such as e-bikes and purely powered modes such as mobility scooters and e-scooters. Some people use the word ‘wheeling’ instead of rolling.
[x] Jacobs, J. (1993) The Death and Life of Great American Cities. New York: Modern Library.
[xi] Goel, R., Goodman, A., Aldred, R., Nakamura, R., Tatah, L., Totaro Garcia, L., Diomedi-Zapata, B., de Sa, T., Tiwari, G., de Nazelle, A., Tainio, M., Buehler, R., Götschi, T. and Woodcock, J. (2021). Cycling behaviour in 17 countries across 6 continents: levels of cycling, who cycles, for what purpose, and how far? Transport Reviews.